
XLSX · Executive Reporting Center
Excel Template for Management Reporting – Free
Executive Reporting Center turns a simple daily table into complete management reporting: day, week, month, quarter and year – compared with a base year, with targets and by department.
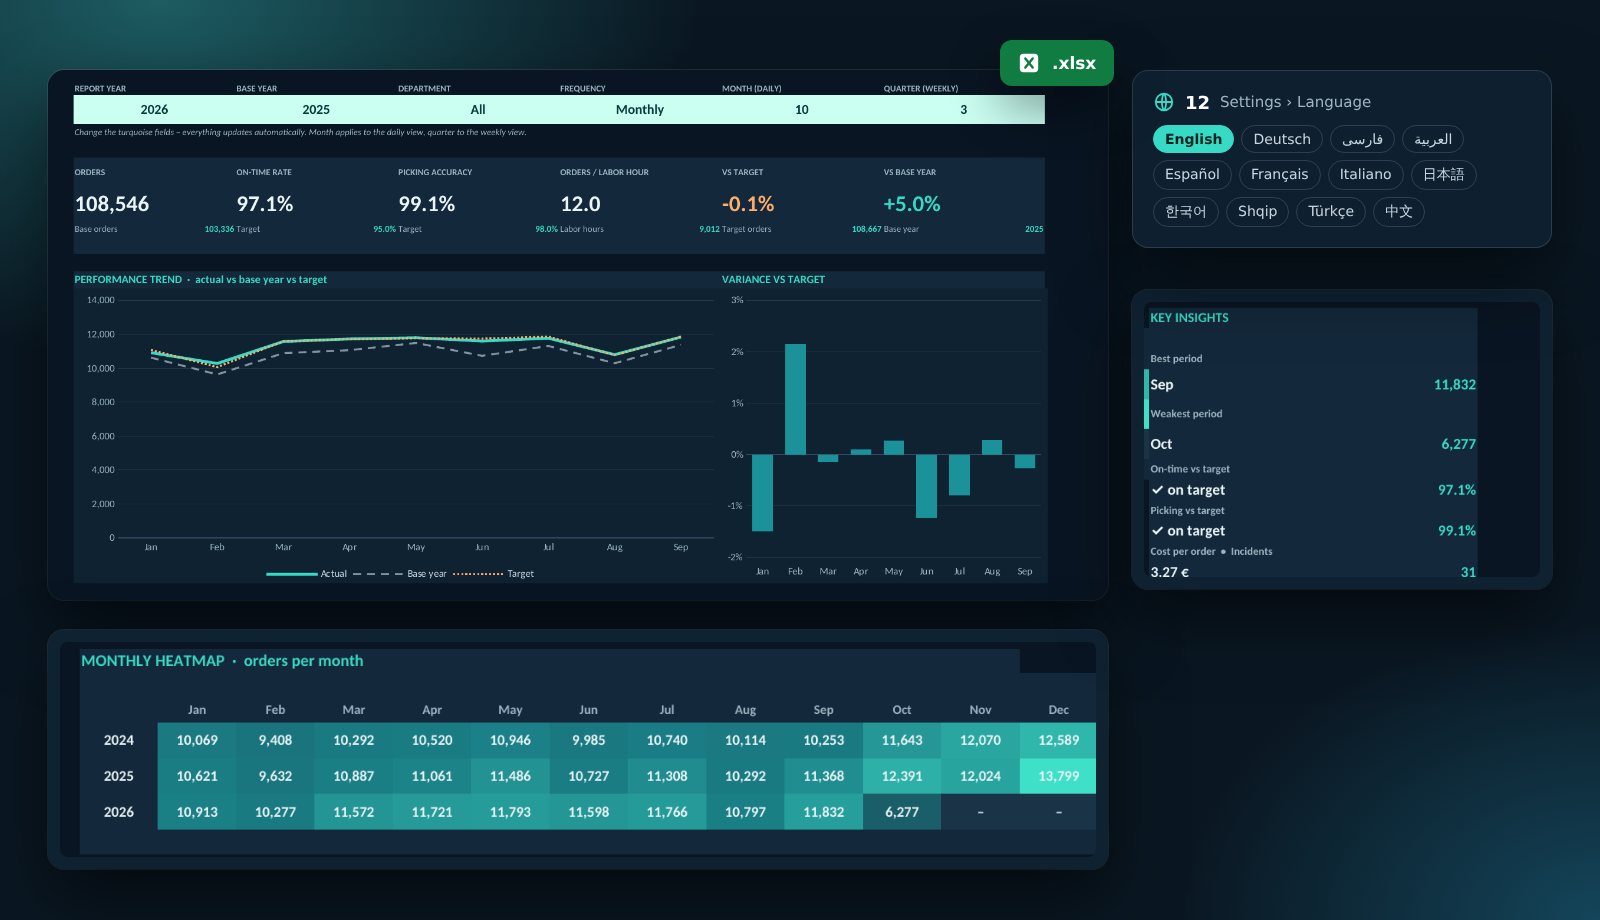
What the template includes
Dashboard with six KPIs
Orders, on-time rate, picking accuracy, orders per labor hour, variance to target and change versus base year.
Five reporting views
One click switches between daily, weekly, monthly, quarterly and yearly views. Weeks follow ISO calendar weeks.
Fair year-over-year comparison
Running periods are compared with the same period of the previous year – not with the full year.
Heatmap, comparison and statistics
A three-year monthly heatmap, year comparison with changes and a statistics page with mean and spread.
Print-ready management report
One sheet with table, chart and key insights – preset to one A4 landscape page.
12 languages, up to 10,000 rows
Switch language in Settings. Protected formulas, no macros, works offline.
Who is it for?
Managing directors, operations and warehouse managers, controllers and team leads who report on performance, punctuality and productivity regularly – without rebuilding spreadsheets every month.
Your report in four steps
- Download the file and open it in Excel.
- In Settings, set language, company, targets and departments.
- In Data Entry, replace the demo data with your own daily data (one row per day and department).
- On the Dashboard, choose year, base year, department and frequency – the Report sheet is instantly print-ready.
KPIs calculated by the template
| Orders (output) | Sum of orders in the periodBasis for volume and trend analysis. |
|---|---|
| On-time rate | On-time orders ÷ ordersDelivery reliability towards customers. |
| Picking accuracy | Correct lines ÷ linesQuality of picking. |
| Orders per labor hour | Orders ÷ labor hoursTeam productivity. |
| Variance to target | Actual ÷ target orders − 1How far results are above or below plan. |
| Change vs base year | Actual ÷ base year (same period) − 1Growth or decline versus the comparison year. |
Frequently asked questions
Is the template free?
Yes, for personal and internal business use. Resale and removing the attribution are not permitted.
What data do I need?
Per day and department: orders, on-time orders, picking lines, correct lines, labor hours, target orders, cost and incidents. Notes are optional.
Can I rename the departments?
Yes. In Settings you can name up to six departments; they appear automatically in the drop-downs.
Why does it only compare equal periods?
So a running year is not compared with a complete previous year – otherwise every running year would look worse than it is.
Can I get a custom version?
Yes. For your own KPIs, data sources (e.g. an SAP export) or your corporate design I can build a tailored version.