
XLSX · Warehouse Intelligence
Warehouse KPI Dashboard in Excel – Free Template
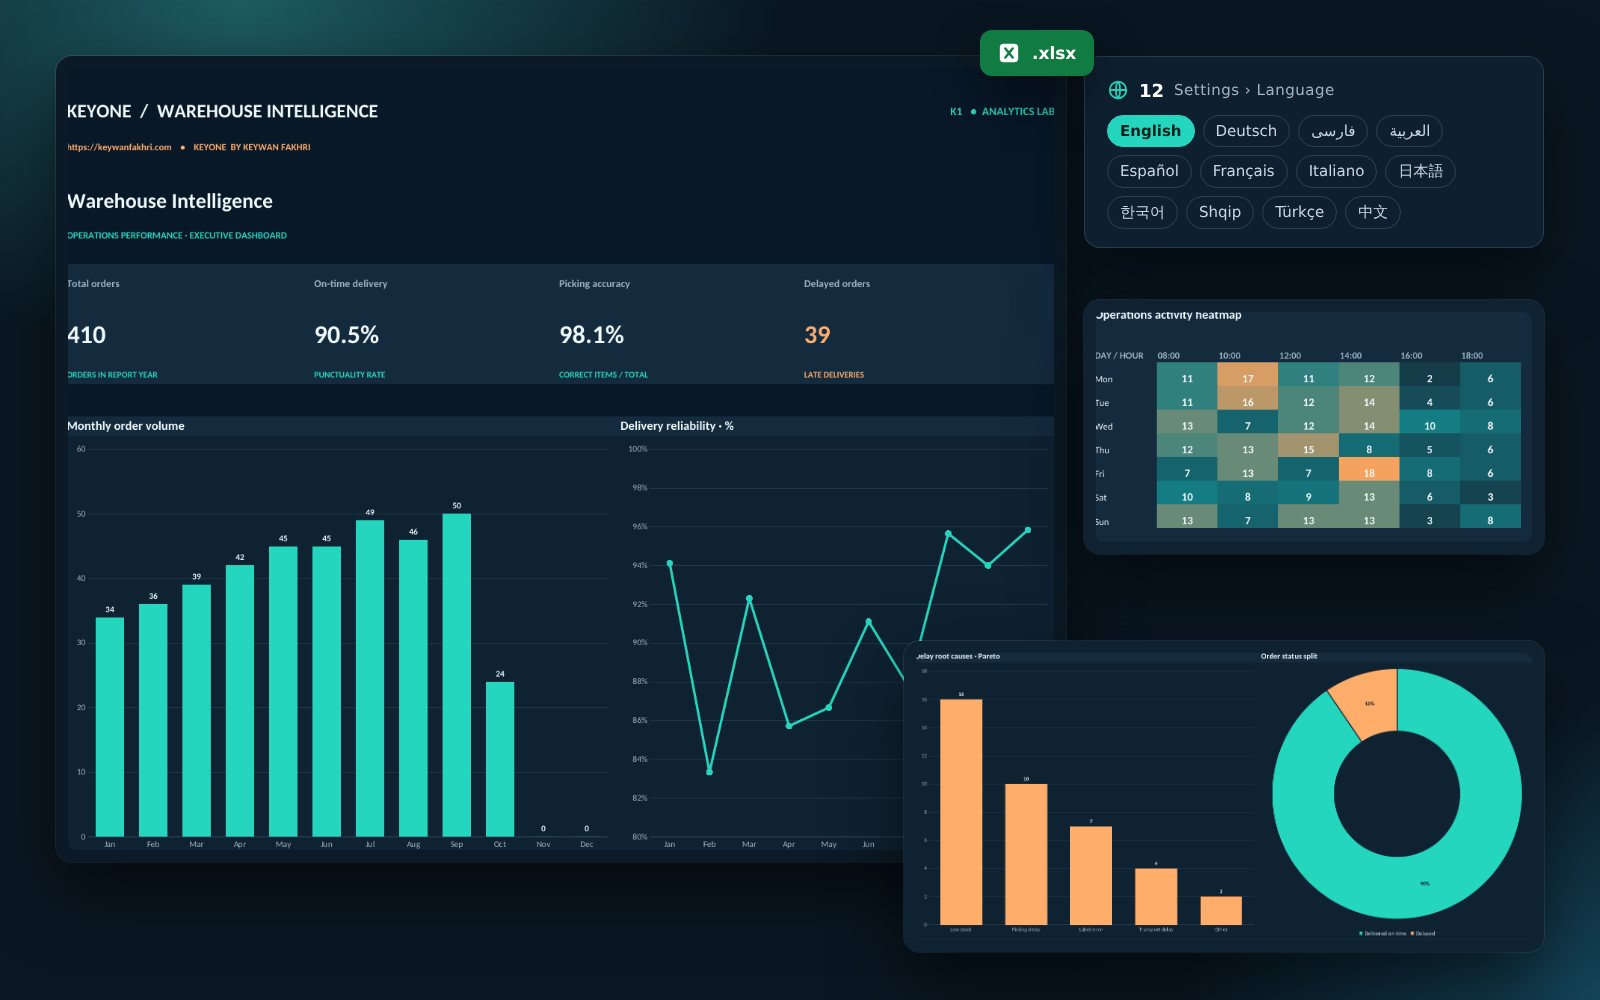
Warehouse Intelligence is a ready-made Excel dashboard for warehouse and shipping teams. Enter your orders – on-time delivery, picking accuracy, late orders and the main causes of delay appear automatically on one page.
What the template includes
Four core KPIs at a glance
Total orders, on-time delivery, picking accuracy and delayed orders – with targets you set in Settings.
Monthly volume and delivery reliability
A column chart shows order volume per month, a line chart shows punctuality across the year.
Pareto of delay causes
Low stock, picking delay, label errors, transport delay – sorted by frequency so you fix the biggest problem first.
Activity heatmap
Weekday × hour shows when your warehouse is busiest – useful for shift and staff planning.
12 languages in one file
English, German, Persian, Arabic, Turkish and more – switchable right inside Excel in Settings.
Protected and offline
Formulas are locked, inputs stay open. No macros, no internet connection, up to 2,000 orders.
Who is it for?
Warehouse managers, shipping leads, logistics controllers and small companies without an expensive BI system who want to report warehouse performance every month – or simply see where most delays come from.
Your report in four steps
- Download the file and open it in Excel.
- In Settings, choose language, report year and targets.
- In the Orders sheet, replace the sample data in the green columns A:L with your own orders.
- Review the dashboard and save it as PDF via File › Export – it fits on one page.
KPIs calculated by the template
| On-time delivery rate | On-time orders ÷ all delivered ordersShare of orders delivered by the promised date. |
|---|---|
| Picking accuracy | Correct lines ÷ picked linesHow error-free picking is – the basis for return and complaint costs. |
| Delayed orders | Number of orders with delivery date > promised dateAbsolute number of late orders in the report year. |
| Mean delay in days | Sum of delay days ÷ delayed ordersHow late delayed orders are on average. |
Frequently asked questions
Is the template really free?
Yes. You may use it free of charge for personal and internal business purposes. Resale and removing the attribution are not permitted.
Does it work with Google Sheets or LibreOffice?
It is built for Microsoft Excel 2016 and Microsoft 365. Calculations largely work elsewhere, but charts may look different.
Can I use my own delay reasons?
The five reasons are fixed so the Pareto chart works reliably. I can build a custom version with your own categories.
How many orders does it hold?
Up to 2,000 orders per file. For larger volumes a custom version or a Power BI solution is recommended.
Is my data sent anywhere?
No. The file contains no macros, no telemetry and no external connections – everything stays on your computer.