
XLSX · Restaurant Profit Analyzer
Restaurant Food Cost & Menu Engineering in Excel
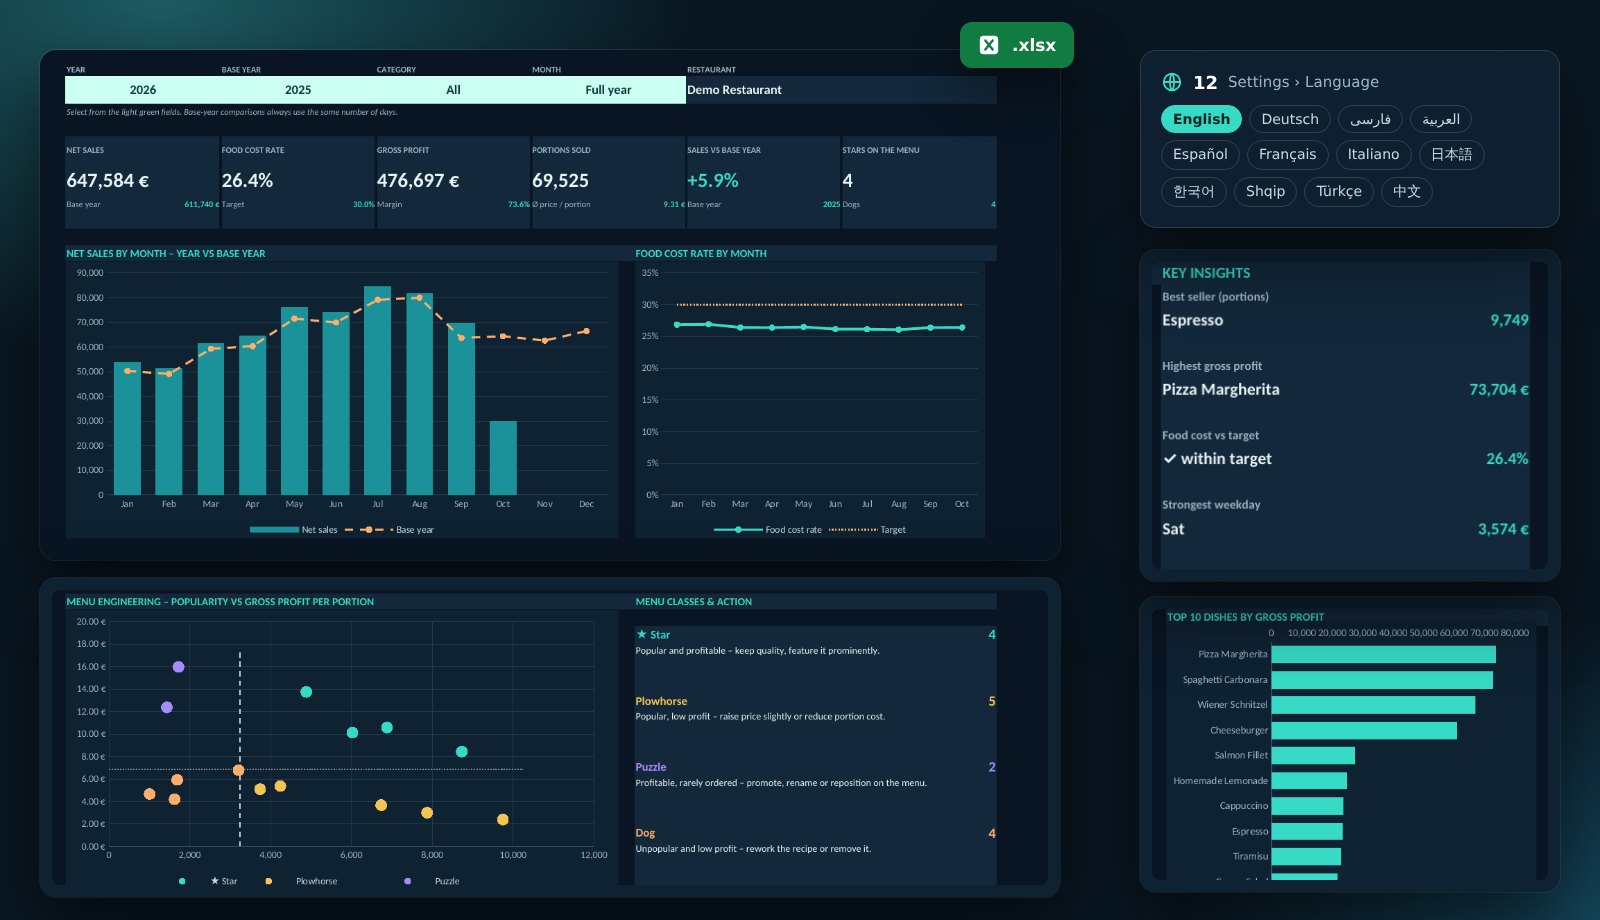
The Restaurant Profit Analyzer shows which dishes really make money. Enter ingredient prices and recipes once, record portions sold each day – food cost, gross profit and the menu engineering matrix are calculated automatically.
What the template includes
Recipe costing with yield
Ingredient prices per kg, litre or piece including trim loss – giving the exact cost of every portion.
Food cost rate and gross profit
Per dish, per month and in total – with a target and a warning when a dish is above it.
Menu engineering matrix
Every dish is classified automatically as Star, Plowhorse, Puzzle or Dog – with a concrete recommendation.
Comparison with last year
Monthly sales against the base year – always on the same number of days, so running months are compared fairly.
Top 10 and weekdays
Your most profitable dishes and average sales per weekday – useful for purchasing and staff planning.
12 languages, protected, offline
Switch the language in Settings. Protected formulas, no macros, up to 20,000 sales rows.
Who is it for?
For owners of restaurants, cafés, bistros and takeaways, head chefs and hospitality consultants who want to manage their menu by numbers rather than gut feeling – without an expensive inventory system.
Four steps to your analysis
- Download the file and open it in Excel.
- Enter purchase prices and yield on “Ingredients”.
- Add dishes, prices and quantities per portion on “Menu” and “Recipes”.
- Replace the demo rows on “Sales” with your own sales (e.g. a POS export) – dashboard and report are ready instantly.
KPIs in the template
| Food cost percentage | Food cost ÷ net salesShare of ingredient cost in sales – typically 28–35 % for food. |
|---|---|
| Gross profit per portion | Net price − food cost per portionWhat each portion contributes to staff and rent. |
| Menu mix | Portions of the dish ÷ all portionsHow popular a dish is compared with the rest of the menu. |
| Popularity threshold | 70 % × (1 ÷ number of dishes)Classic Kasavana & Smith rule: above it a dish counts as popular. |
| Sales vs base year | Sales ÷ sales of the same days in the base year − 1Growth against the comparison year. |
Frequently asked questions
Is the template free?
Yes, free for use in your own business. Resale and removing the attribution are not permitted.
Can I import sales from my POS?
Yes. Most POS systems export item sales as CSV. Copy date, dish and quantity into the “Sales” sheet – the names must match the menu.
Are prices net or gross?
Net, without VAT. That keeps the food cost rate comparable regardless of the tax rate.
What do Star, Plowhorse, Puzzle and Dog mean?
Stars are popular and profitable, Plowhorses popular but low-profit, Puzzles profitable but rarely ordered, Dogs neither. Each class gets a recommendation.
Can I get a customised version?
Yes. I build versions with a drinks menu, several locations, labour cost or a link to your POS.